Excel Percent of Total Formula: Step-by-Step Guide to Calculate Percentage of Total Like a Pro
Imagine staring at a spreadsheet crammed with sales figures, expenses, or grades, wondering how much each slice contributes to the whole. That nagging question—"What percentage is this of the total?"—can halt your momentum dead. But what if you could instantly calculate percentages in Excel, turning raw data into crystal-clear insights? Enter the Excel percent of total formula, your secret weapon for mastering spreadsheets like a pro.
Whether you're an office worker juggling budgets, a data analyst slicing reports, a student crunching grades, or a small business owner tracking sales, this guide unlocks the excel formula for percent of total. We'll dive deep into step-by-step formulas, real-world examples, pro tips, and advanced tricks. By the end, you'll master your math and wield percentages with confidence. Let's transform your Excel game.
Understanding the Excel Percent of Total Formula: The Basics
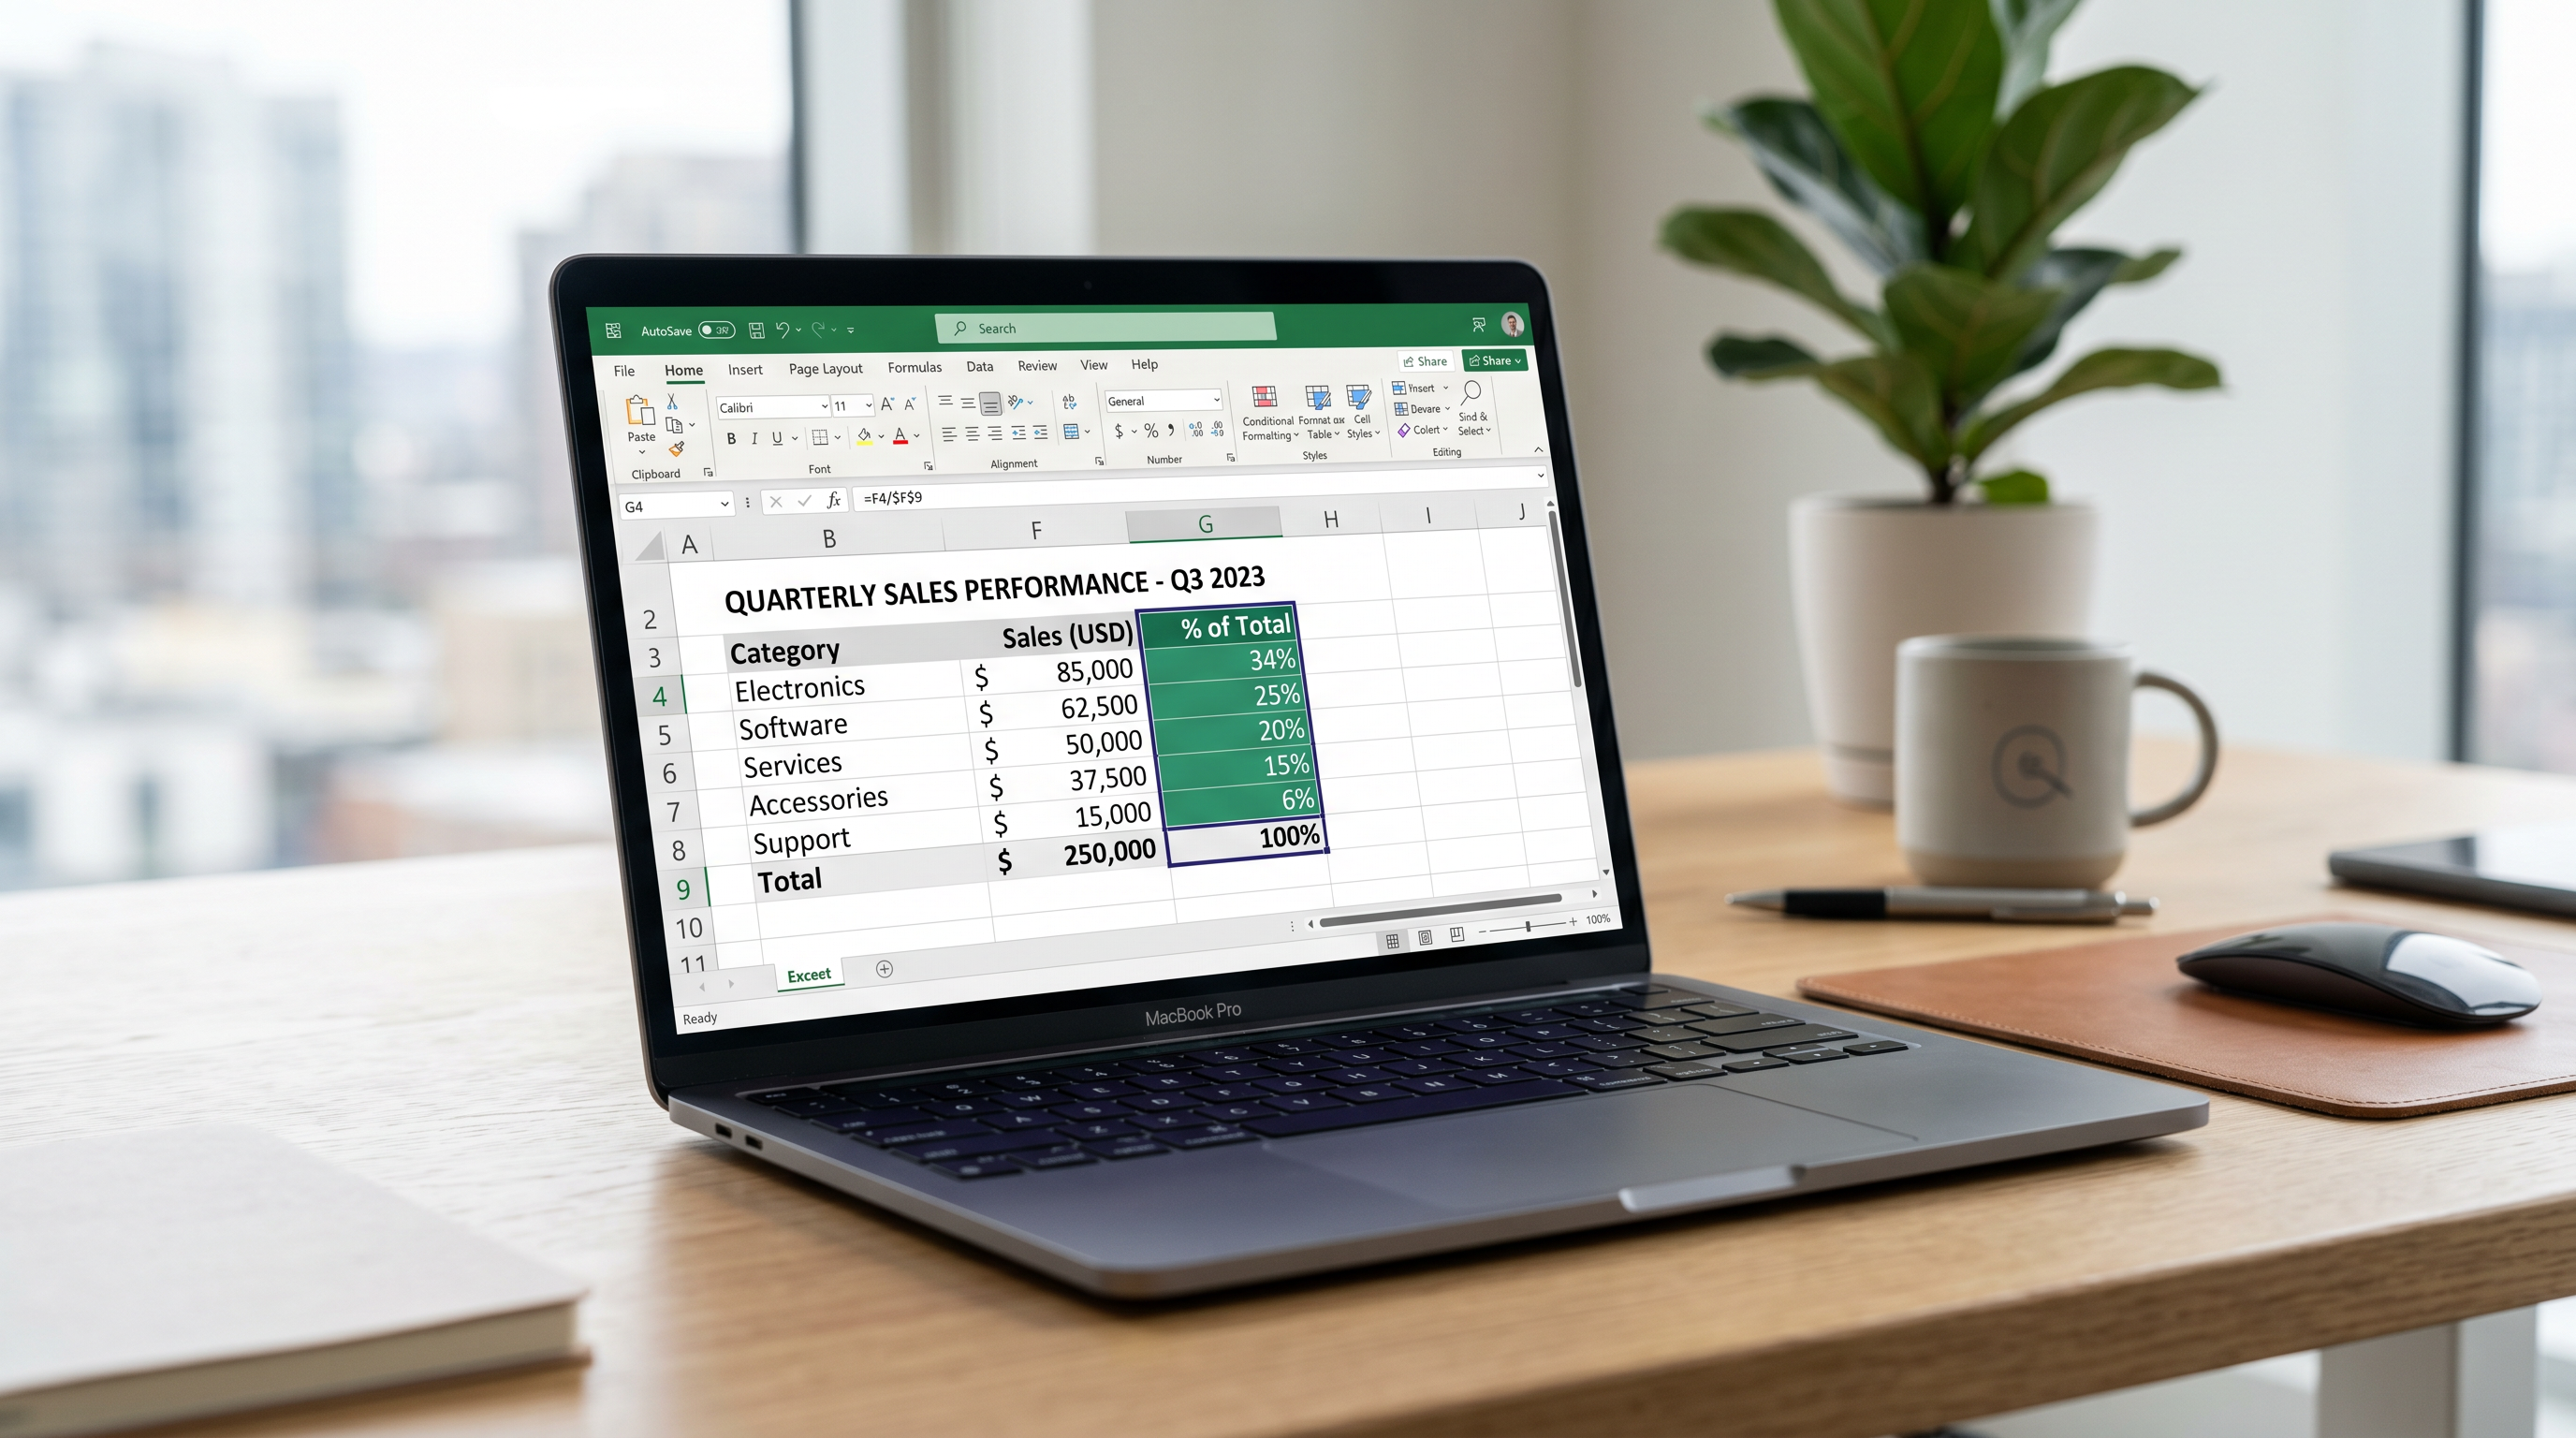
At its core, the Excel percent of total formula follows a simple logic: =part/total. Multiply by 100 for a percentage, or let Excel handle it with the % symbol. Picture a pie chart in equation form—each piece divided by the whole pie.
Here's the breakdown:
- Part: The individual value (e.g., one expense item).
- Total: The sum of all values (use
=SUM()for this). - Formula:
= (B2 / $B$10) * 100or simply=B2 / $B$10then format as %.
Why the dollar signs? We'll cover that next. For now, know this: calculate percentage of total in Excel starts here, powering everything from financial reports to academic trackers.
Why Absolute Cell References ($) Are Crucial for Percent of Total
Copy a formula down a column without absolute references, and chaos ensues. The total cell shifts, skewing every percentage. Enter the $ sign: your anchor in the storm.
B2 / B10becomesC2 / C11when copied—wrong!B2 / $B$10locks the total at B10—perfect.
Pro tip: Press F4 to toggle references. This tiny tweak ensures your Excel percent of total formula scales flawlessly. Skip it, and you're recalculating manually. Master it, and instantly calculate across datasets.
Real-World Examples: Step-by-Step Formulas in Action
Theory sticks when applied. Let's walk through three scenarios with step-by-step formulas. Download a sample workbook from our comprehensive Excel percentage guide to follow along.
Example 1: Budget Expenses – Track Spending Percentages
Sarah, a small business owner, lists monthly expenses: Rent $2,000 (B2), Salaries $5,000 (B3), Marketing $1,500 (B4). Total in B6: =SUM(B2:B4) = $8,500.
- In C2:
=B2/$B$6. - Copy down to C3:C4.
- Results: Rent 23.53%, Salaries 58.82%, Marketing 17.65%.
Now Sarah spots overspending instantly. Scale this to hundreds of line items—pure power.
Example 2: Sales by Product – Boost Revenue Insights
A data analyst reviews Q1 sales: Widgets $12,000 (B2), Gadgets $8,000 (B3), Tools $5,000 (B4). Total B6: $25,000.
- C2:
=B2/$B$6→ 48%. - Copy down: Gadgets 32%, Tools 20%.
- Highlight top performers with conditional formatting.
Suddenly, inventory decisions leap off the page. This is how pros calculate percentage of total in Excel.
Example 3: Student Grades – Ace the Semester Average
A student logs scores: Math 85 (B2), Science 92 (B3), English 78 (B4). Total B6: 255.
- C2:
=(B2/$B$6)*100→ 33.33%. - Copy: Science 36.08%, English 30.59%.
- Weighted? Adjust with multipliers in a new column.
Grades demystified. Master your math for that A+ report.
How to Show Percentage in Excel: Formatting Tips
Formulas compute; formatting dazzles. Right-click your percentage column → Format Cells → Percentage. Boom—clean 24% instead of 0.235.
- Set decimal places: 0 for whole numbers, 2 for precision.
- Percentage button on Home ribbon: One-click magic.
- Custom: "0.00%" for control.
Pair with borders or colors—your data sings. For more, visit PercentPro tools.
Advanced: Percent of Total in PivotTables
Datasets explode? PivotTables handle it. Insert → PivotTable, drag fields to Rows/Values.
- Values: Sum of Sales.
- Right-click value → Show Values As → % of Grand Total.
- Instant dynamic percentages—no formulas needed.
Filter by month? Updates live. This elevates your how to show percentage in Excel skills to enterprise level.
Troubleshooting Common Errors: Fix #DIV/0! and More
#DIV/0! screams "No total yet!" Wrap in IFERROR: =IFERROR(B2/$B$6, "0%").- #DIV/0!: Use
=IF($B$6=0,0,B2/$B$6). - Wrong totals: Verify SUM range.
- Formatting fails: Check cell format overrides.
Debug systematically—your spreadsheets stay bulletproof.
Visualize Percentages with Built-in Charts
Numbers tell; charts sell. Select data → Insert → Pie or Doughnut Chart. Excel auto-labels percentages.
- Pie for budgets: Slices pop visually.
- Bar for sales: Compare side-by-side.
- Add data labels: "% of total" option.
Dynamic? Link to PivotCharts. Stakeholders grasp insights at a glance.
Wrap Up: Become an Excel Percentage Pro Today
From basic =part/total to PivotTable wizardry, you've got the arsenal. Absolute references lock accuracy, examples prove utility, and fixes banish errors. Now, instantly calculate and visualize—watch your productivity soar.
Ready for more? Dive into our full Excel percentage tutorial or explore PercentPro resources. Master your math—the universe of data awaits.