How to Calculate Percentage Difference in Excel: Formula, Steps & Percent Change Comparison
Imagine you're a business owner eyeing two supplier quotes for the same widget—one at $100, the other at $120. Is that a 20% swing? Or are you a student comparing test scores with a classmate, wondering just how wide the gap really is? In the high-stakes world of data analysis, these questions hinge on one crucial calculation: percentage difference in Excel. Yet, here's the kicker—most people muddle it up with percent change, leading to skewed insights, misguided decisions, and that nagging doubt about your spreadsheets. Why does this mix-up happen, and how do you fix it? Let's dive in, because mastering the Excel percentage difference formula isn't just math; it's your edge in a data-driven world.
The Mathematical Backbone: Understanding Percentage Difference
At its core, percentage difference measures the relative gap between two values of equal footing—no hierarchy, no timeline, just a neutral comparison. Think of it as the fair-way to quantify 'how different' without bias toward which value came first.
The formula is elegantly simple yet powerful:
Percentage Difference = |Value1 - Value2| / ((Value1 + Value2) / 2) × 100
Break it down: The absolute value |Value1 - Value2| ensures a positive gap (no negatives muddying the waters). Divide by the average of the two values for a balanced denominator, then multiply by 100 for percentage magic. This symmetric approach shines when values are peers, like rival bids or parallel metrics.
Why not just subtract and divide by one value? That veers into percent change territory—a directional beast we'll tackle soon. For now, know this formula levels the playing field, perfect for analysts dissecting datasets or owners benchmarking costs.
Step-by-Step: How to Calculate Percent Difference in Excel
Excel turns this math into a breeze. Fire up a blank sheet, and let's build it cell by cell. We'll use A2 for Value1 and B2 for Value2—simple, scalable, ready for your data.
- Input your values. Type 100 in A2 (say, Vendor A's price) and 120 in B2 (Vendor B's). Watch those numbers anchor your analysis.
- Grab the absolute difference. In C2, enter
=ABS(A2-B2). Hit Enter—Excel spits out 20. The ABS() function keeps it positive, no matter the order. - Compute the average. In D2, type
=AVERAGE(A2,B2). Result: 110. This midpoint denominator is key to fairness. - Assemble the full Excel percentage difference formula. In E2, unleash:
=ABS(A2-B2)/AVERAGE(A2,B2). You'll see 0.1818...—the raw decimal. - Format as percentage. Select E2, right-click > Format Cells > Percentage (2 decimals). Boom: 18.18%. That's your percent difference in Excel, crisp and professional.
Pro tip: For an all-in-one punch, use that combined formula in E2 from the start. Copy-paste ready, battle-tested for any two-value showdown.
Percent Difference vs. Percent Change in Excel: The Critical Distinction
Here's where confusion breeds errors. Percent difference treats values as equals—no 'before' or 'after.' It's bidirectional, ideal for snapshots like competitor pricing or A/B test results.
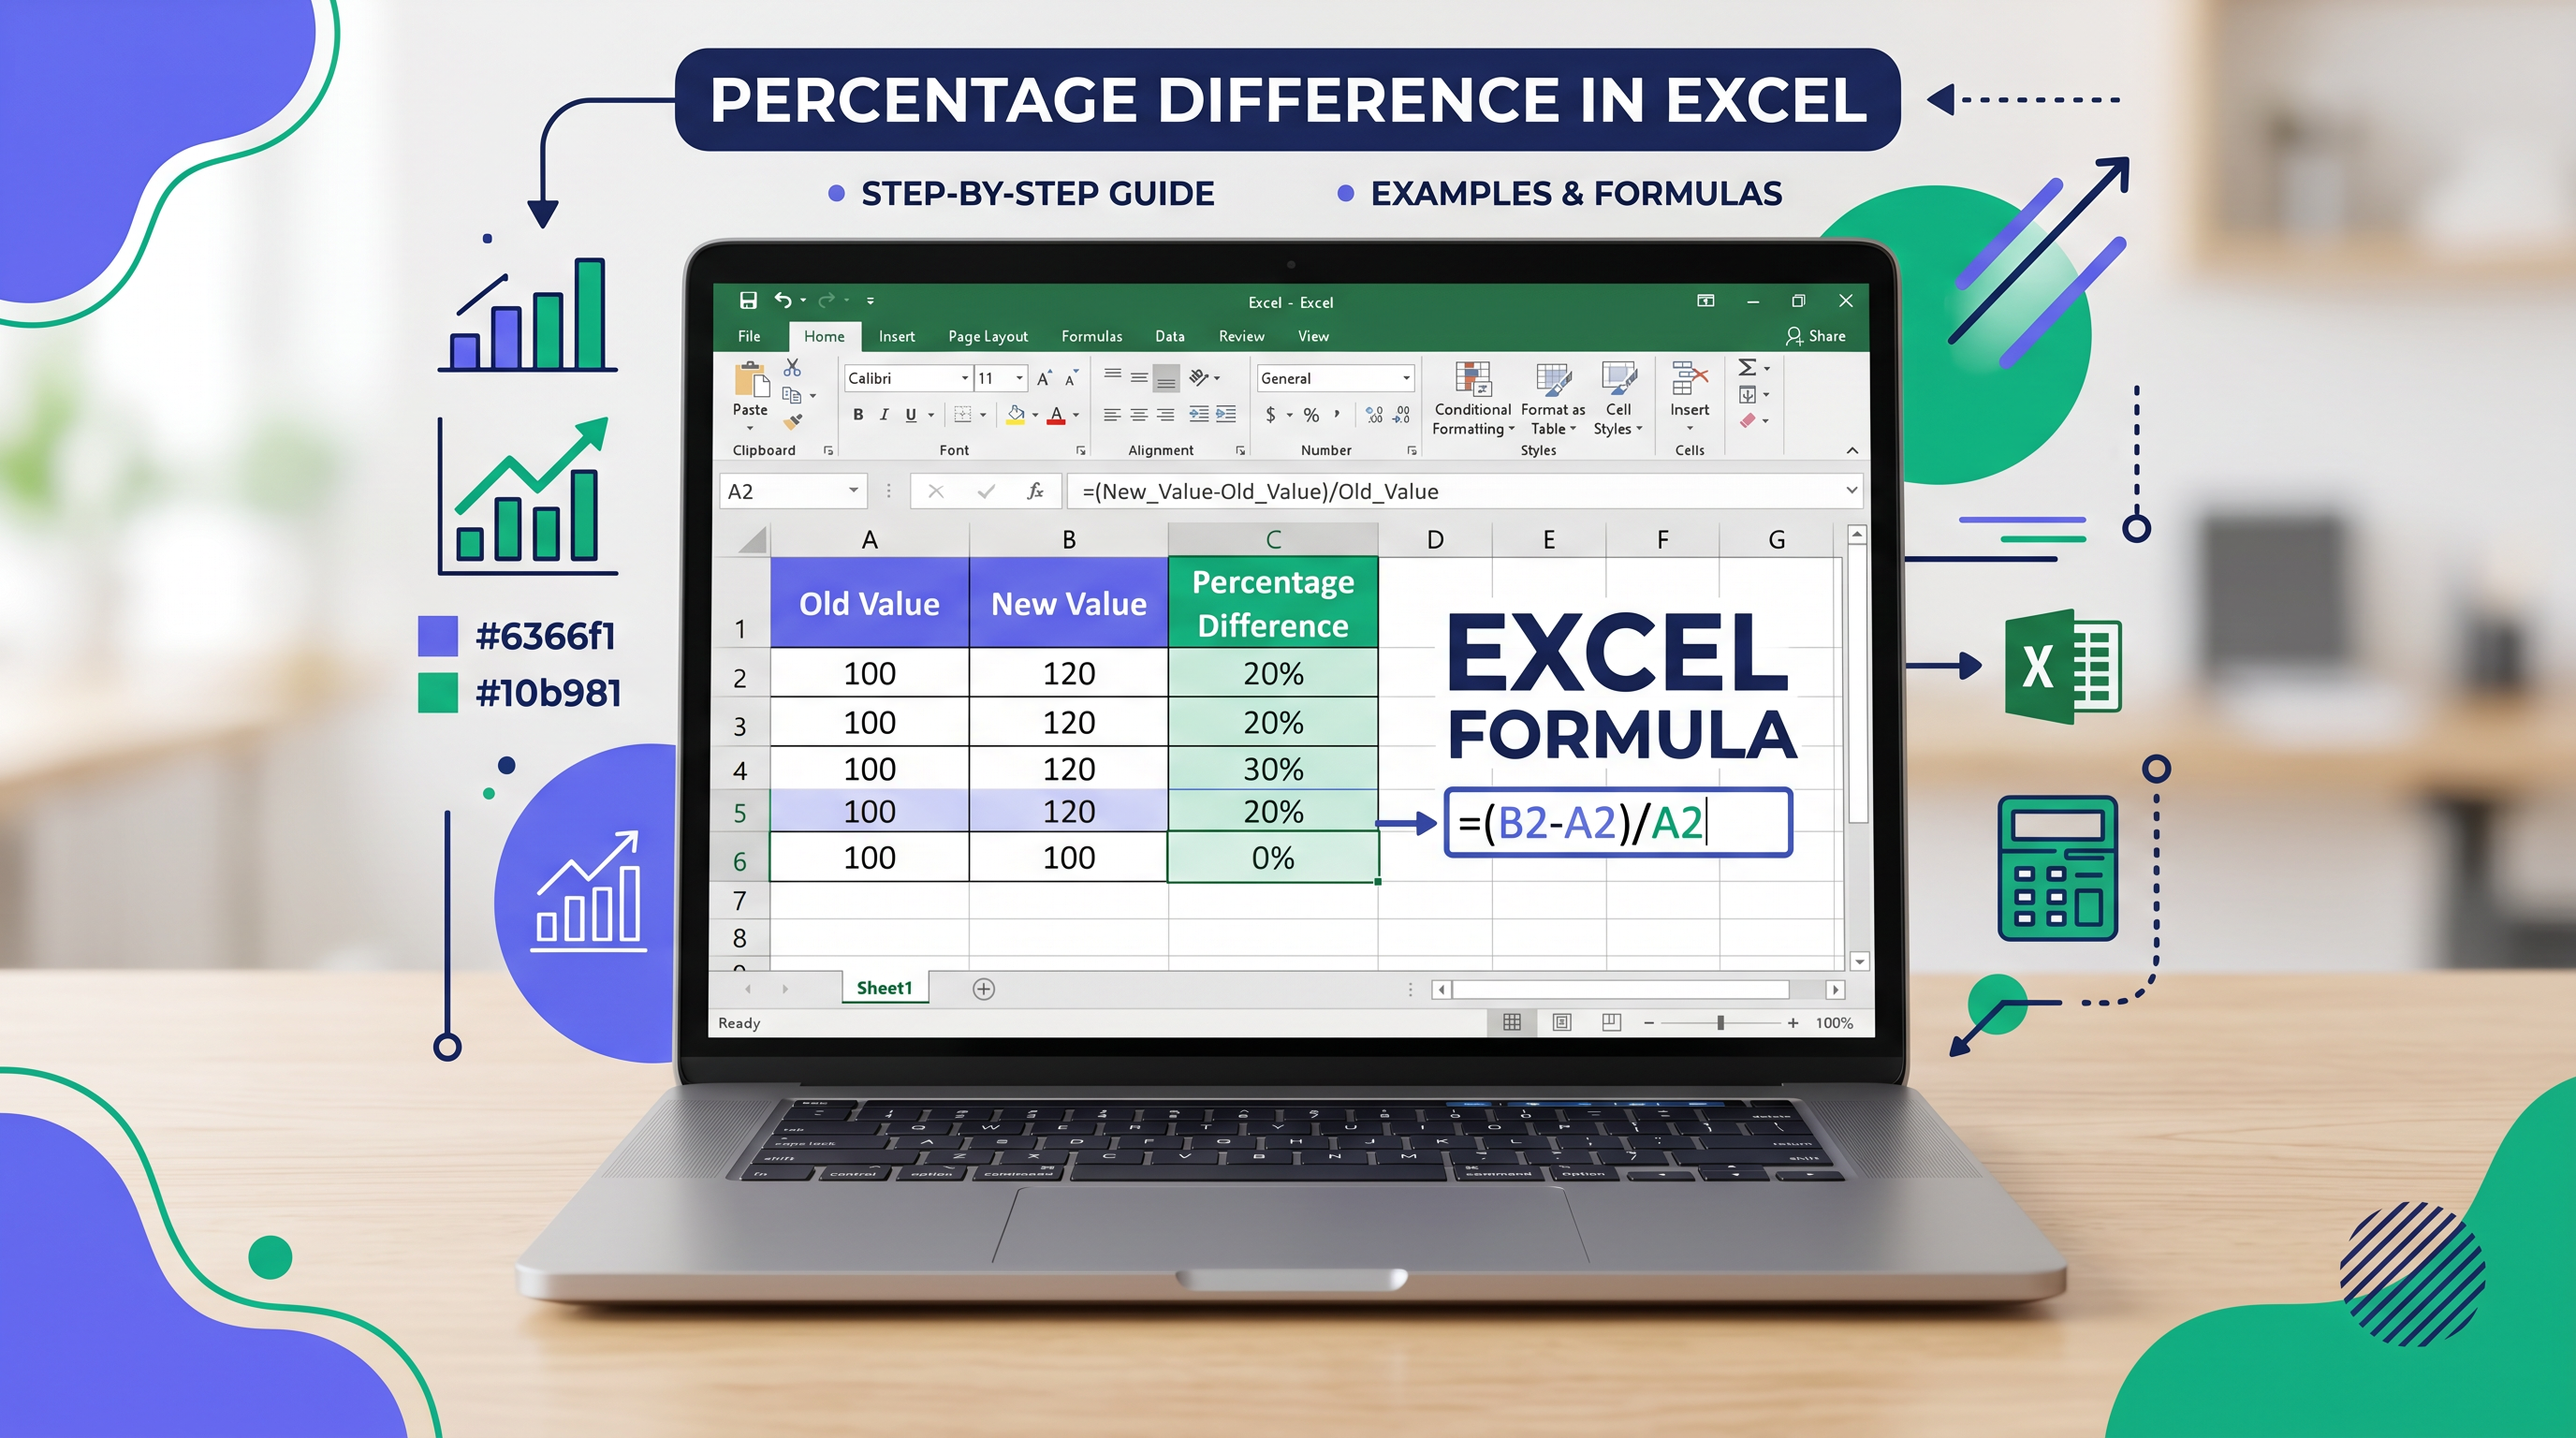
Percent change? That's storytelling with time. Formula: (New - Old) / Old × 100. Positive for growth, negative for decline. Use it for sales trajectories or stock dips, where direction matters.
Picture this: Your sales jumped from 100 to 120 units. Percent change: 20% growth. But comparing to a rival's steady 120? Percent difference: 18.18%—less dramatic, more apples-to-apples. Mix them up, and your boardroom pitch flops. For quick percent change calcs, try our Percent Change calculator. Need instant difference? Jump to the Percent Difference calculator.
| Metric | Formula in Excel | Best For |
|---|---|---|
| Percent Difference | =ABS(A2-B2)/AVERAGE(A2,B2) | Equal comparisons (vendors, scores) |
| Percent Change | =(B2-A2)/A2 | Time-based shifts (growth/decay) |
Real-World Examples: Percentage Difference in Action
Example 1: Vendor Price Comparison
Business owners, this one's for you. Two quotes: Vendor A ($100), Vendor B ($120).
| Vendor | Price | % Difference |
|---|---|---|
| A | $100 | — |
| B | $120 | 18.18% |
Negotiation ammo: Switch if over 15%? Your call.
Example 2: Student Test Scores
Students and educators: You vs. peer—85% vs. 92%.
| Student | Score | % Difference |
|---|---|---|
| You | 85% | — |
| Peer | 92% | 7.89% |
Gap analysis for study tweaks.
Example 3: Budgeted vs. Actual Costs
Analysts: Budget $5,000, actual $5,500.
| Category | Budgeted | Actual | % Difference |
|---|---|---|---|
| Costs | $5,000 | $5,500 | 9.52% |
Scaling for Power Users: Reusable Templates in Excel
One row? Cute. Real datasets demand more. Column A: Item names. B: Value1. C: Value2. Drop =ABS(B2-C2)/AVERAGE(B2,C2) in D2, format percentage. Double-click the fill handle (bottom-right corner)—drag down magic populates the column. Thousands of rows? Done in seconds. Analysts, this is your workflow accelerator.
- Lock references with $ for fixed headers:
=ABS($B2-$C2)/AVERAGE($B2,$C2). - PivotTables next: Summarize differences fleetly.
- For our full suite, visit the all-in-one percentage tool homepage.
Pitfalls to Dodge: Common Errors in Excel Percent Difference
Even pros slip. Here's your shield:
- No ABS(): Negative results flip your insight.
- Wrong denominator: Skip AVERAGE? Bias creeps in (e.g., divide by smaller value inflates).
- Parentheses amnesia:
=ABS(A2-B2)/AVERAGE(A2,B2)—miss them, chaos. - Zero values: Division by zero? Use IFERROR:
=IFERROR(ABS(A2-B2)/AVERAGE(A2,B2),"N/A"). - Confusing with change: Always ask: Time-based? No? Difference it is.
Master Your Data: The Path Forward
You've got the Excel percentage difference formula, steps etched in memory, pitfalls sidestepped. From boardrooms to classrooms, this tool sharpens your edge—turning raw numbers into narratives that persuade and illuminate. Next time a dataset stares you down, pause: Difference or change? Choose right, calculate clean, conquer. Master your math, one spreadsheet at a time.